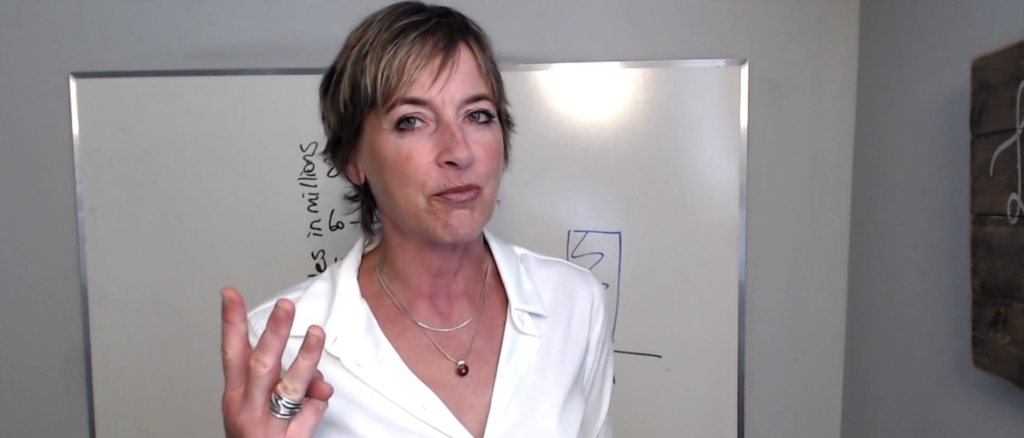
Say It With Charts!
Don’t data dump! Inspired by my favorite data storytelling book, Say It With Charts by Gene Zelazny, these two videos will help you tell a story with your data.
How should you present a chart?
Be a good movie director using a wide shot, medium shot and close shot.
Grappling with how much information to put in your presentation?
Consider two things about your audience: how hungry they are and how much they need to know about the food before they eat it.
Share this
- By Ken Pillipow
- Categories: Uncategorised
Search Posts
Latest Posts
Categories
Categories
Archives
Archives
- January 2024
- June 2023
- May 2023
- April 2023
- October 2022
- September 2022
- March 2022
- October 2021
- April 2021
- April 2020
- February 2020
- November 2019
- October 2019
- August 2019
- March 2019
- October 2018
- May 2018
- June 2017
- May 2017
- April 2017
- February 2017
- September 2015
- August 2014
- June 2014
- April 2014
- March 2014
- February 2014
- January 2014
- November 2013
- July 2013
- April 2013
- March 2013
- February 2013
- January 2013

